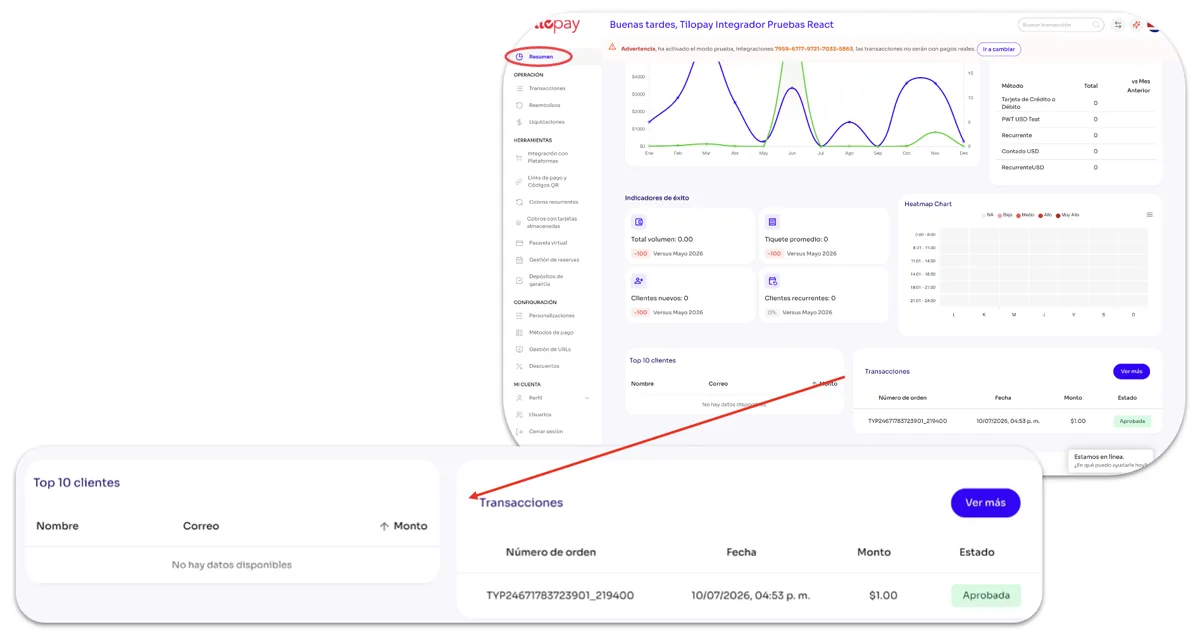
What information can I find on the Tilopay Admin Dashboard Overview screen?
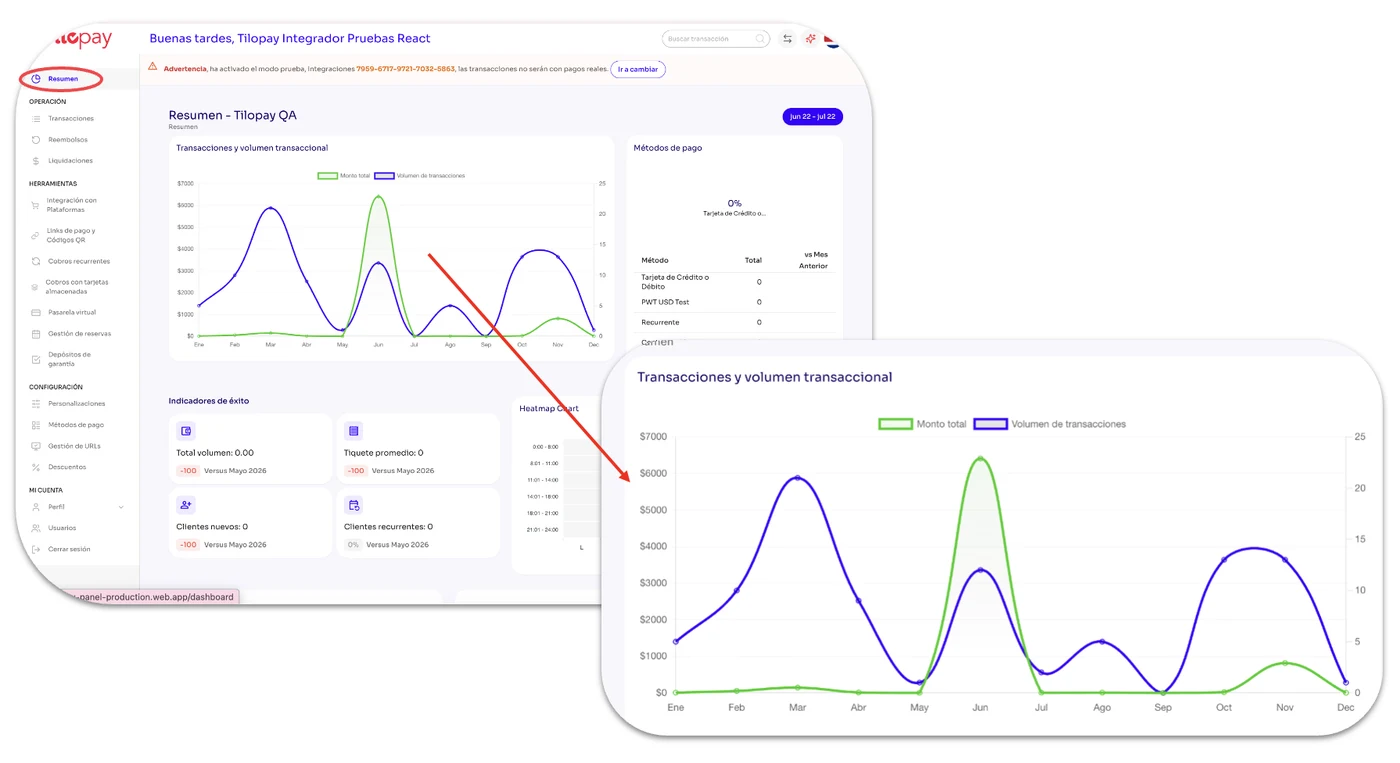
The Transactions and Transaction Volume chart in the Tilopay Admin Dashboard lets you see the number of transactions processed and the total volume over a specific period. It makes it easy to analyze overall performance based on the period you select.
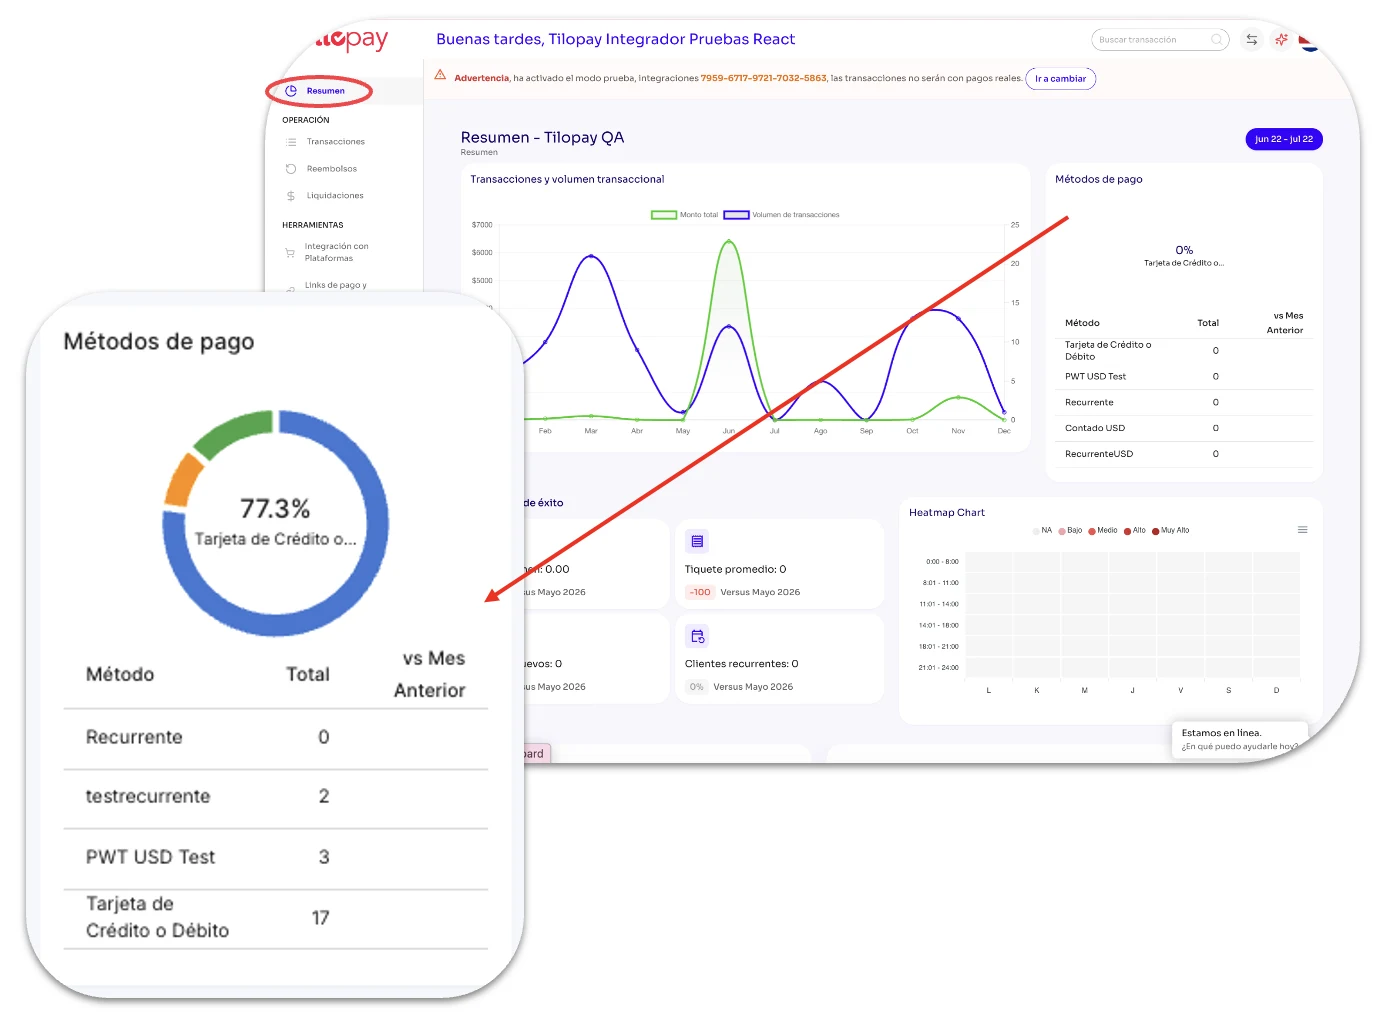
The Payment Methods chart shows you the distribution of transactions by the payment methods your customers used. It helps you identify customer trends and preferences during the selected period.
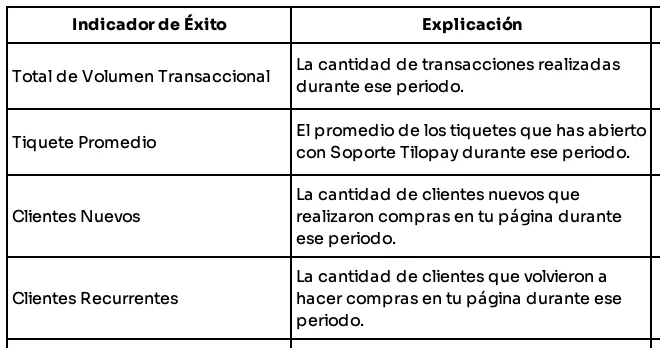
The Success Metrics show you the following metrics for the selected period and compare them with the previous month:
The Heatmap gives you a visual representation of transaction activity over specific periods. It makes it easy to identify patterns and activity spikes.
The Top 10 Customers table shows you the 10 customers who make the most transactions on your website during the selected period.
The Transactions section lists your transactions with the key details you need to quickly review them during the period you selected.